Free fishbone diagram maker
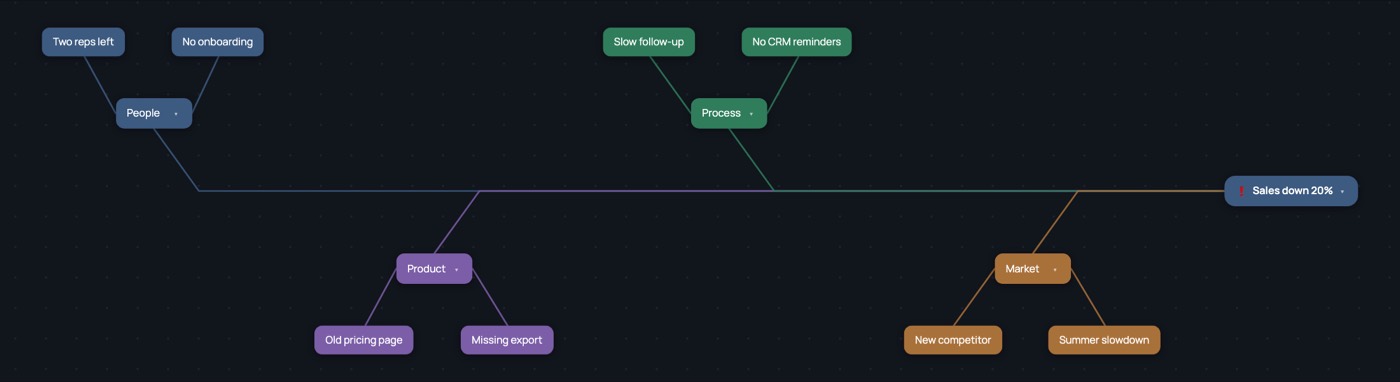
A fishbone diagram — also called an Ishikawa or cause and effect diagram — puts a problem at the head and its possible causes along the bones. Dendra draws it for you in the browser, free, with nothing to install.
Open this example Start from a blank map
When to use one
Use a fishbone when something went wrong and the team jumps straight to a favourite explanation. Drawing every possible cause first, grouped by kind, stops the loudest idea from winning by default and shows where to look before anyone fixes anything.
How to make a fishbone diagram in Dendra
- Write the problem in the central bubble. Make it specific and measurable: “Sales down 20% since June”, not “sales are bad”.
- Pick the fishbone layout. Open Tools › Layout, choose Fishbone and press Apply. The problem moves to the head on the right and a spine appears.
- Add the main categories. Select the head and press Tab for each bone. Common sets are People, Process, Product and Market, or the classic 6 Ms: Method, Machine, Material, Manpower, Measurement, Environment.
- Add causes under each bone. Select a category and press Tab again. Keep asking “why?” and go one level deeper when the answer is still too vague to act on.
- Mark what to check. Give a cause a colour or an icon, a note with what you found, or a due date for whoever looks into it.
- Share it. Export a PDF or PNG for the meeting, or send the map in a link so others get their own copy.
Tips
- Stick to four to six bones. More than that usually means two categories are really one.
- Write causes, not solutions. “No CRM reminders” is a cause; “buy a CRM” is for later.
- Switch the same map to Tree or Outline to read it as a list — nothing is lost when you change the layout.
About Dendra · Manual · Terms · Privacy